In the realm of financial trading, technical traders use a variety of tools to understand market behavior and predict future trends. One such tool is the candlestick pattern chart. Keep reading for a detailed exploration of this instrumental trading tool.
Understanding Candlestick Pattern Chart
A candlestick chart is a financial chart used to depict price movements in trading. Originally created by Japanese rice traders, this type of chart now plays a prominent role in every trader’s toolbox. For further insights on what is a candlestick pattern chart, delve into the following sections.
This complex yet versatile instrument records the open, high, low, and closing prices of a security for specific periods. The chart is made up of multiple candlesticks, each representing a period. This period might be a day, week, hour, or even a minute, depending on the trader’s preference.
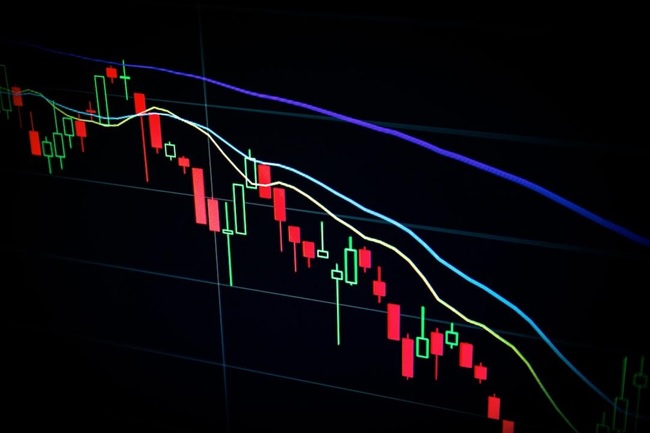
Each candlestick comprises a body and one or two “wicks” or “shadows” protruding from it. The body signifies the range between the opening and closing prices, while the wicks show the highest and lowest prices during the period. A colored or filled body symbolizes a closing price lower than the opening price (bearish), whereas an empty or white body indicates a closing price higher than the opening price (bullish).
The benefit of using candlestick charts lies in their ability to give a visual representation of the market’s mood. Traders can track market trends and detect possible reversals with a quick glance, thus enabling informed investment decisions.
Principal Elements of a Candlestick Chart
A single candlestick on a chart represents four vital trading elements: the opening price, closing price, high price, and low price within a specified period. A filled-in, or black, body denotes a period where the closing price was less than the opening price. An empty or white body, conversely, means the closing price was higher. This color scheme, however, can vary based on the chart’s design and the trader’s preference.
The length of the wicks and the bodies portray market volatility. Longer wicks and bodies imply high volatility, whereas shorter ones indicate low volatility. Recognizing these parts will facilitate a better understanding and interpretation of various price actions and possible market turns.
The candlestick’s shape can describe market sentiment during a trading period. For instance, a long body signals a strong buying or selling activity, with the color indicating who has the upper hand—the bulls or the bears.
Interpreting Various Candlestick Patterns
Mastering the art of recognizing and interpreting candlestick patterns is the key ingredient to successful trading. These patterns provide valuable insights into potential future movements of security.
For instance, a “doji” signifies indecision in the market, thus signaling a possible reversal point. Likewise, long white or blank candlesticks indicate strong buying interest, whereas long black or filled candlesticks signal strong selling interest.
The “hammer” is a potential bullish reversal pattern that occurs at the end of a downtrend. Conversely, the “shooting star” implies a possible bearish reversal, signaling the end of an uptrend. Familiarity with these and other numerous patterns will enhance the trader’s ability to make informed decisions.
An effective strategy is not to rely solely on individual candlestick patterns but rather combine them with other chart patterns and technical indicators. This combination will provide a more robust and accurate prediction system.
Role of Candlestick Patterns in Trading Strategy
The primary role of candlestick patterns within a trading strategy is to help identify potential market reversals, providing a chance for traders to enter or exit a trade. They also assist in identifying the current state of the market, whether it’s trending, ranging, volatile, or calm.
Knowledge of candlestick patterns also allows traders to plan their entries and exits. For instance, one might use a certain pattern to enter a bullish position or another pattern to exit a bearish position.
Meticulous observation of patterns over time also helps traders assess the strengths and weaknesses of their strategy for a specific market. This helps them make necessary adjustments to improve their profitability.
Overall, successful trading requires a combination of a well-established strategy, sound money management, robust risk management, and familiarity with various trading tools. Candlestick patterns play a significant role in strengthening this foundation.
Altogether, candlestick patterns provide an efficient way to interpret market sentiments, forecast potential price reversals, and bolster trading strategies. Their continued use over centuries is a testament to their effectiveness. Regardless of whether you are a seasoned trader or a beginner, familiarity with different candlestick patterns will undeniably enhance your trading strategy.